What maternal age related risk equation does αlpha use?
The risk at term of an individual woman having a Down's syndrome pregnancy is given by (1,2,3) :
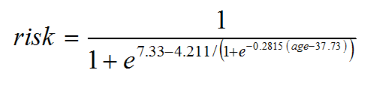
Where age is the woman's age in years at the expected date of delivery. The age is expressed as a decimal fraction, so for example 25 years 6 months is 25.5 years.
Second trimester Down's syndrome risks are approximately 23% higher than term risk on account of the selective fetal loss of Down’s syndrome pregnancies. In the first trimester, the risk of Down’s syndrome is approximately 43% higher than at term (3).
The following table shows the risk at term corresponding to the age at expected date of delivery.
| Age at expected date of delivery (years) | Risk at term |
|---|---|
| 15 | 1/1516 |
| 16 | 1/1512 |
| 17 | 1/1508 |
| 18 | 1/1502 |
| 19 | 1/1494 |
| 20 | 1/1484 |
| 21 | 1/1470 |
| 22 | 1/1452 |
| 23 | 1/1430 |
| 24 | 1/1400 |
| 25 | 1/1362 |
| 26 | 1/1315 |
| 27 | 1/1255 |
| 28 | 1/1182 |
| 29 | 1/1095 |
| 30 | 1/994 |
| 31 | 1/881 |
| 32 | 1/759 |
| 33 | 1/634 |
| 34 | 1/513 |
| 35 | 1/403 |
| 36 | 1/308 |
| 37 | 1/231 |
| 38 | 1/172 |
| 39 | 1/129 |
| 40 | 1/98 |
| 41 | 1/76 |
| 42 | 1/61 |
| 43 | 1/50 |
| 44 | 1/43 |
| 45 | 1/38 |
| 46 | 1/34 |
| 47 | 1/31 |
| 48 | 1/29 |
| 49 | 1/28 |
| 50 | 1/27 |
| 51 | 1/26 |
| 52 | 1/25 |
| 53 | 1/25 |
| 54 | 1/25 |
| 55 | 1/24 |
References
1. Revised estimates of the maternal age specific live birth prevalence of Down’s syndrome (2002)
2. Corrections to maternal age-specific live birth prevalence of Down's syndrome (2005)
3. Estimating the risk of Down's syndrome in antenatal screening and the gestation at which this risk applies (2007)