AutoMonitor
αlpha already includes the most advanced and comprehensive monitoring facilities available for Down's syndrome screening. The introduction of AutoMonitor in αlpha 8 is a further significant improvement.
The AutoMonitor screen shows at-a-glance information on the performance of your screening program and highlights any issues which need further investigation. It complements the existing monitoring features in αlpha 8.
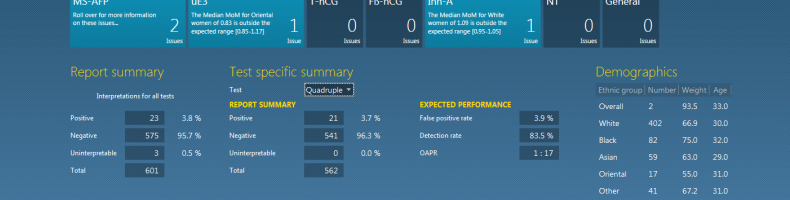
The screen below shows an example of the AutoMonitor screen for a screening program using the quadruple test. The sections below provide further information. Click on the image to see an enlarged version.
AutoMonitor continuously analyses recent screening reports issued by αlpha and highlights issues on several tiles:
Issues Tiles
The issues tiles aggregate all issues for each marker in one place.
In the image below issues have been identified for AFP, uE3 and inhibin-A. For uE3 and inhibin-A the median MoM for certain ethnic groups is outside the expected range. These can be analysed further with the statistical monitoring functions.

Report Summary
This section provides data on the numbers of patients screened and the report interpretations. More detailed information is given in the statistics feature Report Summary.
The figure shows the percentage of positive, negative and uninterpretable tests performed in the analysed period.

Test Specific Summary
When several tests are being carried out at the same centre (for example the Triple test, Quadruple test and Integrated test) it is important to regularly compare the observed and expected performance for each of these tests. More detailed information is given in the Statistics features Report Summary and Screening Performance.
The figure below shows the Test Specific Summary for the Quadruple test and compares the observed performance given in the Report Summary with the Expected Performance. The observed screen positive rate and expected false positive rate are similar.

Demographics
The demographics section provides information on the ethnicities screened including weight and age. More detailed information is given in the Statistics feature Population.
The figure below shows the demographics section which gives the number, median weight and age of each ethnic group screened in the analysed period.

Screening Markers
This section summarises a great deal of information in one table:
- Count - Number of reports using that marker
- All groups - Median MoM in all ethnic groups.
- Median MoM for each ethnic group .
If any of the Median MoMs are significantly different from 1.0 MoM then an issue would be raised. More detailed information is provided using the Statistics feature Tabulations.
If Nuchal Translucency is being used in the screening program then the number of measurements and median NT MoM for each sonographer is also shown on a snippet. More detailed information is provided using Nuchal Translucency Monitor.
The figure below shows the markers section which gives, for each serum marker, the number of measurements and the median MoM grouped by ethnicity.
